
Updated for version 6.0.30
Celestory lets you put a sketch, a small sprite or a logo right on the graph, next to your blocks. Three tools are available: freehand drawing, pixel art and SVG image import. They help you illustrate, explain or decorate your graph, for yourself and for your team.
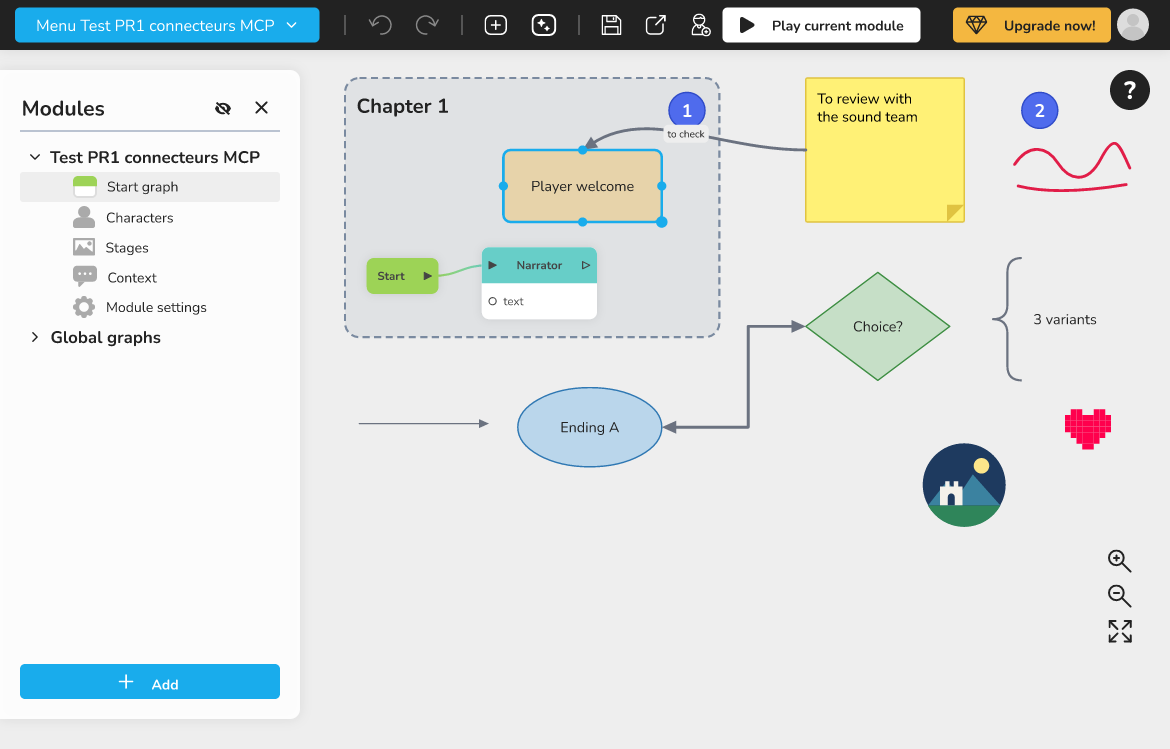 a graph with, next to a few blocks, a red freehand drawing, a small pixel art and an imported SVG image
What it is for
These drawings are annotations of the graph, like the arrows and sticky notes described in Annotating the graph: arrows, shapes and sticky notes. They are not blocks: they have no input or output and are not part of the story. The player never sees them, and neither the build nor the exports read them.
You can, for example:
- sketch the plan of a scene next to the blocks that make it up;
- circle or underline an area of the graph that needs more work;
- add a logo or an icon to mark a part of the project;
- draw a small pixel art illustration to find your way around faster.
Where to find the tools
Right click an empty area of the graph, then choose Shapes. The three tools of this article are at the end of the list: Freehand drawing, Pixel art and SVG image…. The item is placed where you right clicked (except freehand drawing, which goes where you draw).
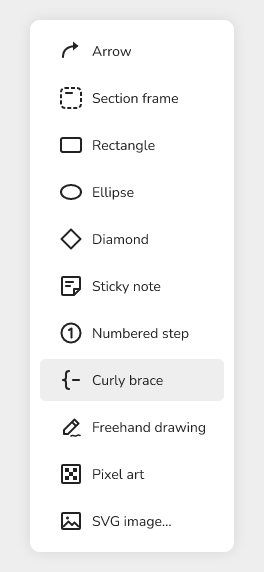 the graph right click menu with the Shapes submenu open, showing the entries Freehand drawing, Pixel art and SVG image…
Drawing freehand
- Right click the graph, then choose Shapes > Freehand drawing. A message reminds you how to put the pen down.
- Draw on the graph while holding the mouse button (or your finger) down.
- To finish, put the pen down: press Escape, right click, click Done, or click outside the graph.
While the pen is on, a toolbar called Pen appears at the top of the graph. It holds:
- seven round colors (the last one is white);
- three thicknesses: Thin, Medium and Thick;
- Eraser: it erases each whole stroke you touch; click a color or a thickness again to take the pen back;
- Done: puts the pen down.
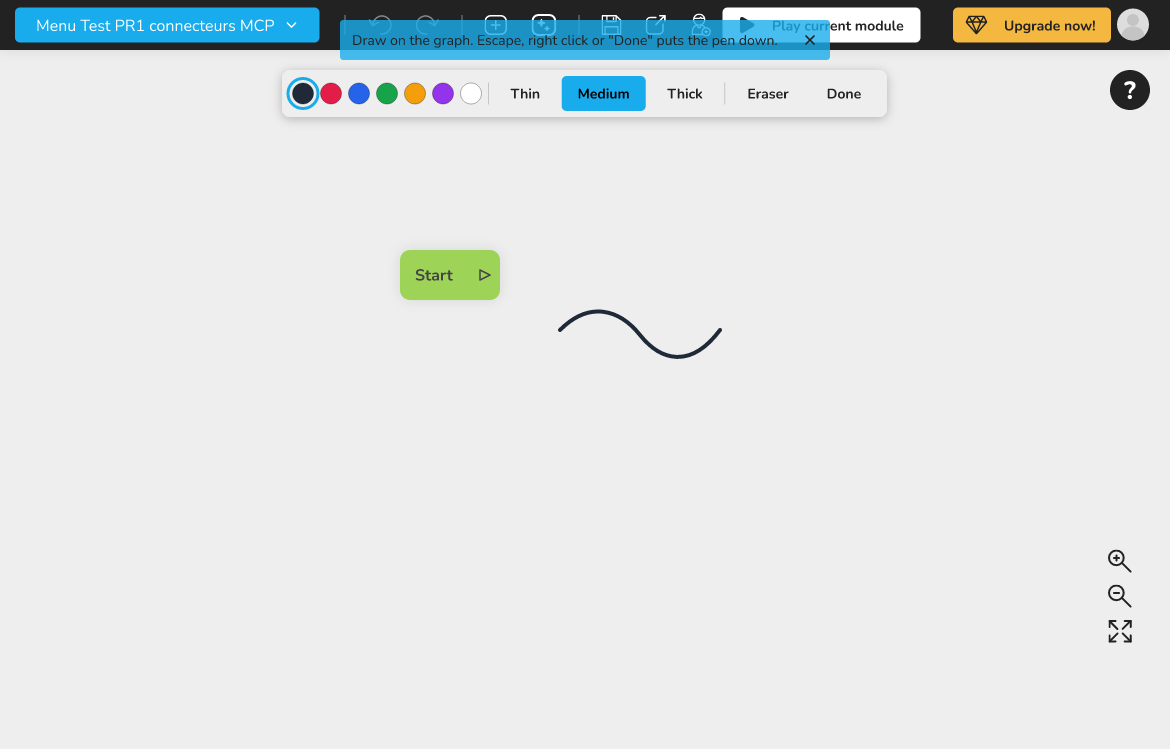 the graph in pen mode, with the Pen toolbar at the top (colors, Thin, Medium, Thick, Eraser, Done) and a drawing in progress
All the strokes drawn in one session make a single drawing, which you can then move, copy or delete in one go. Each stroke is a step of the history: you can undo one stroke without losing the others. If the eraser removes the last stroke of a drawing, the drawing disappears, along with the arrows linked to it. When you put the pen down, the drawing is selected.
Editing a drawing
Select the drawing, right click, then choose Edit the annotation (a double click on the drawing also opens the editor). The Drawing editing window offers:
- Color of the N strokes: one color for every stroke of the drawing;
- Original proportions: restores the original width/height ratio of the drawing, if you stretched it when resizing.
To change the size of the drawing, select it, then drag its bottom right corner. Pixel arts and SVG images are resized the same way.
Painting a pixel art
Pixel art is a small image made of big squares, perfect for a sprite, an icon or a backdrop.
- Right click the graph, then choose Shapes > Pixel art.
- An empty 16 by 16 pixel art is placed on the graph, selected, and the Pixel art window opens.
- Pick a color in the Palette, then click or drag on the grid to paint.
- To erase pixels, choose Eraser in the palette, then click or drag on the grid.
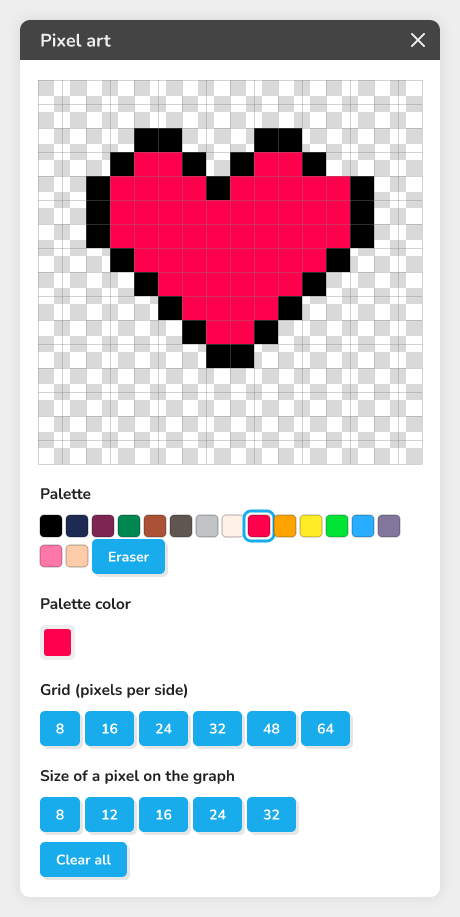 the Pixel art window with the grid being painted, the 16 color palette and the settings below
Each brush stroke (from click to release) is a step of the history. The settings of the window:
| Setting | What it does |
|---|---|
| Palette | 16 colors, plus Eraser to empty a pixel |
| Palette color | Changes the color of the selected palette cell: every pixel of that color changes with it |
| Grid (pixels per side) | Size of the grid: 8, 16, 24, 32, 48 or 64; changing it keeps the top left part of the drawing |
| Size of a pixel on the graph | Size of a square on the graph: 8, 12, 16, 24 or 32 |
| Clear all | Empties the grid |
💡 Tip: to paint in a color that is not in the palette, first select a palette cell, then change it with Palette color. The pixels already painted with that cell take the new color too.
To reopen the window later, select the pixel art, right click, then choose Edit the annotation.
Importing an SVG image
An SVG file is a vector image (a logo, a diagram, an icon). Celestory does not keep the file itself: it draws it once as an image and keeps only that image, so nothing coming from the file is ever run.
- Right click the graph, then choose Shapes > SVG image….
- Select an
.svgfile on your computer. - The image is placed on the graph, selected. If it is large, it is scaled down so that its longest side does not exceed 300 on the graph; you can then resize it by dragging its bottom right corner.
Only the elements of the file that draw are kept: the rest is removed for safety.
To see how much the image weighs, select it, right click, then Edit the annotation: the Image editing window shows its size in pixels and its weight in the project (for example "1024 × 768 pixels, 120 KB in the project"). The Original proportions button restores its width/height ratio.
SVG image limits
- a file of 1 MB at most;
- 5,000 elements at most in the file;
- 2 MB of images at most per graph, all images together;
- the file must state its size (a width and a height, or a viewBox).
Troubleshooting
When you import, a red message explains what is wrong:
| Message | Solution |
|---|---|
| Only SVG images can be imported | Export your image as SVG in your drawing app, or draw it with the pen or the pixel art |
| This file is not a valid SVG image | Open it in a drawing app and export it again as SVG |
| This SVG file is too large (over 1 MB) | Simplify or shrink it in your drawing app |
| This SVG image has too many elements (over 5,000) | Simplify it in your drawing app |
| For safety, this SVG file contains instructions that are not allowed | Export it again as "plain SVG" or "optimized SVG" |
| This SVG image could not be read | Open it in a drawing app and export it again |
| This SVG image does not say how big it is | Give it a width and a height (or a viewBox) in your drawing app |
| This image is still too heavy for the project, even scaled down | Simplify it: fewer details or gradients |
| This graph already holds too many images (2 MB in all) | Remove an image from the graph, or draw with the pen or the pixel art, which weigh almost nothing |
The last message also appears when you paste a selection that contains images and the graph has no room left: the extra images are not pasted.
Good to know
- Drawings, pixel arts and images are not part of the story: they do not appear in the app or in the exports.
- A freehand drawing and a pixel art weigh almost nothing in the project. SVG images weigh more, hence the 2 MB limit per graph.
- Imported images are still pictures: changing the original SVG file does not change the image on the graph, you have to import it again.
Asking the AI assistant for a drawing
The AI assistant that builds your graph can add a freehand drawing or a pixel art to the graph. It cannot import an SVG image: for that, use Shapes > SVG image….